
October 2026 · 30-compound peptide market study
The PeptidePrices Market Report for October 2026
108,860 price observations. 6,429 distinct in-stock listings. 10,507 COA records compiled. Here is what we found from a full month of daily data.
Data collected through · Latest monthly report
After months of work, we wired in our daily price scraper, set to run every morning at 4 a.m. Eastern. We were not sure what the data would tell us. Now we have a much clearer picture.
We are proud to present our first full month of peptide price tracking data, along with the certificate-of-analysis paperwork to go with it. We followed 30 compounds across our vendor directory. Here is what we found.
Key findings
- Of 10,507 public COA records for 30 compounds collected through Oct 21, 2026, 89.2% report purity, 37.5% endotoxin testing and 10.5% a fentanyl screen.
- Within the 30-compound cohort on Oct 21, 2026, Retatrutide has the deepest archive at 1,577 public reports, followed by Tirzepatide at 1,048.
- The standard three-test panel appears together in 7,038 reports (67.0%) in the 10,507-record cohort through Oct 21, 2026. Purity, identity and content are the common baseline; broader testing is less frequent.
- Among 4,577 in-stock listing entries checked Oct 14, 2026–Oct 21, 2026, 1,975 (43%) match an issuer-verified COA with explicit vendor attribution for the exact compound, strength, unit and reviewed form.
- In the 4,414-entry price comparison captured Oct 21, 2026, the lower-price third had 65.3% public COA coverage versus 53.9% in the upper-price third.
The standard three-test panel dominates, but broader testing drops off.
Purity, identity and content have become the standard three tests in this cohort: 7,038 of 10,507 reports (67.0%) contain all three. Additional testing is still less frequent.
Our interpretation: the added cost of broader panels likely contributes to the drop-off. For testing breadth, we consider documented six- and seven-test panels the gold standard, especially when they include relevant contamination tests.
- Purity 89.2%9,377 records
- Content 86.6%9,102 records
- Identity 70.2%7,375 records
- Endotoxin 37.5%3,936 records
- Microbial / sterility 23.3%2,453 records
- Heavy metals 19.7%2,068 records
- Fentanyl screen 10.5%1,102 records
Share of retained report identities with an explicitly recorded test field. Individual reports can include several tests.
The grouped microbial / sterility row counts each report once: 1,522 report microbial testing (14.5%), 1,040 report sterility (9.9%), and 109 report both. Microbial testing and sterility testing are distinct; grouping them does not make them interchangeable.
Download this chart (PNG) ↓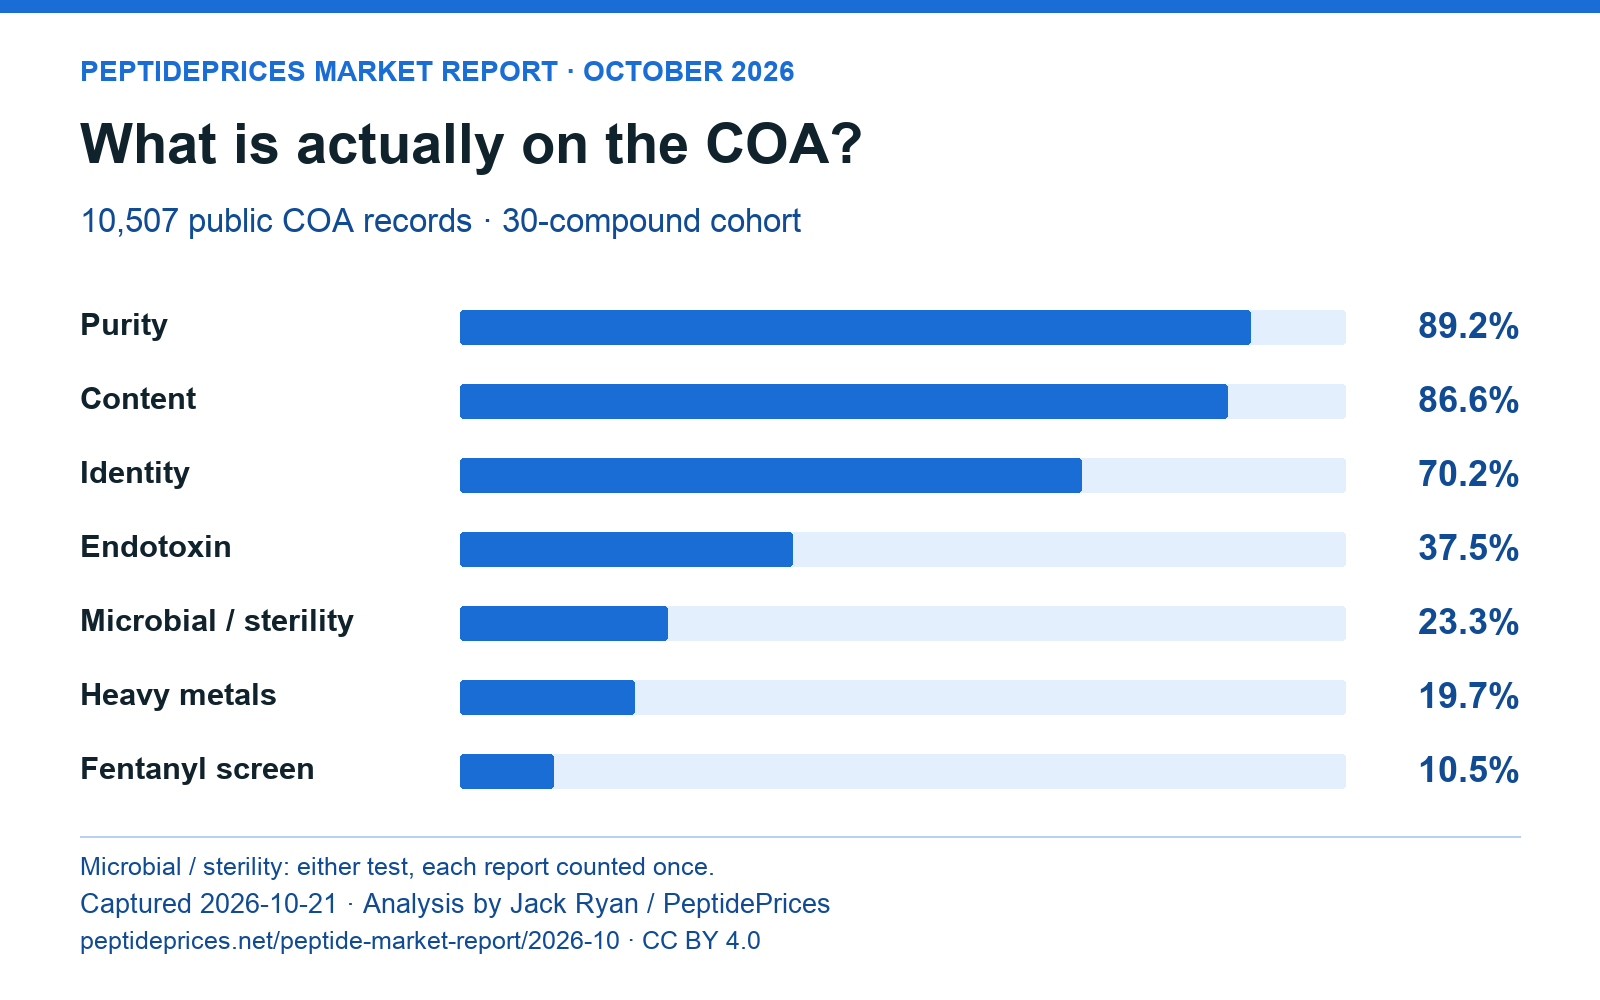
Plenty of paperwork. Fewer than half of listings have an exact verified match.
1,975 of 4,577 listing entries (43%) checked Oct 14, 2026–Oct 21, 2026 matched an issuer-verified record with explicit vendor attribution for the exact compound, nominal strength, unit and reviewed form or package mapping.
SS-31 (Elamipretide)
52%83 of 160 listings
BPC-157
49%125 of 255 listings
Retatrutide
45%246 of 541 listings
GHRP-6
24%8 of 33 listings
These examples use the same exact-match rule across compounds. An available laboratory report must match the listing’s compound, nominal strength, unit and reviewed form, with explicit vendor attribution.
Exact listing coverage is separate from archive size: the 10,507-record cohort includes historical reports and checked files across its retained verification states.
Paying more did not buy more testing evidence
The lower-price third had public COA documents for 65.3% of entries, compared with 53.9% in the upper-price third. The median documented panel contained 4 tests in the lower-price third and 3 in the upper-price third.
The comparison covers 4,414 current listing entries in 93 comparable package groups. Each group matches compound, nominal strength, unit, formulation, package count and total quantity.
| Price third | Public COA coverage | Source-attributed issuer match | Median tests | 7+ tests, known panels |
|---|---|---|---|---|
| Lower | 65.3% | 40.2% | 4 | 20.0% |
| Middle | 61.4% | 47.3% | 3 | 10.1% |
| Upper | 53.9% | 43.6% | 3 | 4.8% |
Seven-or-more-test panels represented 20.0% of known-panel lower-price entries and 4.8% of upper-price entries. Source-attributed issuer coverage was 40.2% and 43.6%, respectively. Laboratory and vendor composition differed across price thirds.
Our interpretation: competitively priced vendors appear to be more operationally sophisticated and to have a better grasp of the testing evidence researchers look for.
Retatrutide dominates the COA archive
1,577 public reports put Retatrutide first among the 30 compounds at the Oct 21, 2026 capture. Those reports span 242 vendor archives; the 1,000 verified, source-attributed records represent 170 vendors.
Our interpretation: the concentration of Retatrutide reports and vendor participation points to strong researcher demand for this compound.
Tirzepatide follows with 1,048 reports across 188 vendor archives.
Prices moved. So did the catalog.
The Sep 21, 2026–Oct 21, 2026 daily package medians rose for 8 compounds, fell for 18 and stayed unchanged for 4. Median compound change was -0.35%; the arithmetic mean was -3.81%.
Tracked endpoint listings grew 14.3%–100.0% per compound as the collected vendor and strength mix changed. These first-to-last changes describe that changing package mix, rather than price changes for a fixed product basket.
The 12 largest first-to-last package-median changes.
Moving the window one day earlier changes BPC-157 from -0.5% to +7.4%; Tirzepatide from -9.1% to -2.2%; and IGF-1 LR3 from -9.1% to +0.4%. Endpoint timing and catalog expansion materially affect these figures.
| Compound | Sep 21, 2026 median | Oct 21, 2026 median | Change | Public COAs | Verified & attributed |
|---|---|---|---|---|---|
| Retatrutide | $118.99 | $110.00 | -7.6% | 1,577 | 1,000 |
| BPC-157 | $48.25 | $48.00 | -0.5% | 684 | 424 |
| TB-500 | $55.88 | $55.00 | -1.6% | 438 | 278 |
| MOTS-c | $61.00 | $61.50 | +0.8% | 669 | 463 |
| NAD+ | $69.99 | $69.99 | 0.0% | 558 | 356 |
| Semax | $39.99 | $39.99 | 0.0% | 369 | 211 |
| Selank | $41.27 | $42.99 | +4.2% | 354 | 216 |
| CJC-1295 (With DAC) | $55.00 | $55.00 | 0.0% | 82 | 52 |
| Tesamorelin | $75.00 | $75.50 | +0.7% | 601 | 412 |
| Ipamorelin | $49.99 | $49.00 | -2.0% | 349 | 209 |
| Melanotan-1 (MT-1) | $39.99 | $39.14 | -2.1% | 161 | 114 |
| Glutathione | $59.99 | $59.99 | 0.0% | 251 | 161 |
| Semaglutide | $70.00 | $65.00 | -7.1% | 386 | 251 |
| Tirzepatide | $99.00 | $90.00 | -9.1% | 1,048 | 711 |
| Cagrilintide | $75.99 | $78.50 | +3.3% | 234 | 151 |
| AOD-9604 | $55.00 | $54.99 | −<0.1% | 261 | 160 |
| CJC-1295 (No DAC) | $50.00 | $49.99 | −<0.1% | 201 | 117 |
| GHRP-6 | $43.99 | $31.50 | -28.4% | 37 | 22 |
| GHRP-2 | $35.50 | $30.00 | -15.5% | 36 | 18 |
| Hexarelin | $56.50 | $50.50 | -10.6% | 33 | 16 |
| Sermorelin | $55.00 | $58.00 | +5.5% | 239 | 152 |
| IGF-1 LR3 | $82.50 | $75.00 | -9.1% | 175 | 109 |
| Cerebrolysin | $80.00 | $60.00 | -25.0% | 25 | 17 |
| Epithalon (Epitalon) | $49.00 | $50.00 | +2.0% | 297 | 205 |
| FOXO4-DRI | $174.50 | $164.99 | -5.4% | 54 | 31 |
| SS-31 (Elamipretide) | $65.50 | $69.50 | +6.1% | 271 | 180 |
| GHK-Cu (Copper Peptide) | $45.99 | $45.00 | -2.2% | 720 | 456 |
| Melanotan-2 (MT-2) | $39.01 | $39.99 | +2.5% | 309 | 194 |
| Snap-8 | $38.50 | $33.49 | -13.0% | 79 | 48 |
| L-Carnitine (Injectable) | $50.00 | $49.91 | -0.2% | 9 | 6 |
Current market prices
Price-index snapshot checked through 2026-10-21. These normalized prices use one eligible offer per distinct vendor, after the index’s outlier filter. They are separate from the study’s package medians.
| Compound | Distinct vendors | Median price per mg |
|---|---|---|
| GHK-Cu | 250 | $0.57 |
| MOTS-c | 247 | $3.50 |
| Retatrutide | 245 | $5.21 |
| BPC-157 | 237 | $4.90 |
| Tesamorelin | 232 | $7.00 |
| NAD+ | 218 | $0.11 |
| Tirzepatide | 204 | $3.47 |
| Semax | 202 | $4.00 |
| KLOW Protocol | 199 | $1.37 |
| TB-500 | 198 | $6.00 |
For journalists
Dataset DOI: 10.5281/zenodo.23548874
Analysis by Jack Ryan, PeptidePrices. For source questions or an interview, contact support@peptideprices.net.
Methods, downloads and reuse
How this study was calculated
Price window. Sep 21, 2026–Oct 21, 2026 inclusive: one full month of prices, 31 daily collection dates. 30 compounds in the catalog’s popularity order qualified with all dates and at least 5 collected observations at each endpoint. Catalog rank is the selection rule, rather than a measured sales or visitor ranking.
Scale. 108,860 collected price observations include daily repeat observations of products. The final capture contains 6,429 distinct public in-stock listings, identified by compound, vendor, normalized product URL and quantity.
Price measurement. Daily median listed package prices across collected in-stock vendor/strength mixes, before coupons, shipping and tax. Missing dates remain gaps. For each compound, return is (last median ÷ first median − 1) × 100. Compounds have equal weight in the median and mean return.
COA depth and panels. 10,507 public report identities belong to the selected 30-compound cohort, rather than the entire site library. Checked files remain included; issuer verification and explicit source attribution are separate breakdowns. Each test-field share divides its recorded count by all cohort records. Reports can contain several fields; unknown fields remain unknown. The microbial / sterility group is the union of report identities, with reports containing both counted once. Microbial enumeration or specified-organism testing and sterility testing answer different questions; see the FDA Pharmaceutical Microbiology Manual. Report counts describe certificate identities, rather than production-batch counts.
Exact coverage. Current public in-stock listings checked Oct 14, 2026–Oct 21, 2026 were matched to the public listing-evidence projection captured Oct 21, 2026 using the site’s exact identity rules. Present evidence is not backdated into the historical price series.
Price and testing. Equal prices receive average ranks within comparable package groups containing at least three vendors. The 4,414 included entries span 93 groups. Median test counts and seven-plus shares use known panels; public-document coverage includes all selected evidence states. Laboratory mix and vendor clustering affect the observed distributions.
Retatrutide archive vendors. The 170-vendor figure counts the verified, explicitly source-attributed archive subset. The 1,577-record total includes the wider public archive for Retatrutide.
Recorded exception. The October 15 Ouralus $1 comma-parser error remains flagged in the underlying captured source. The historical medians are the captured API medians. No minimum-price finding uses the defective observation.
Window sensitivity. The downloadable JSON retains one-day-shift comparisons. The shifted comparison uses the same number of dates and actual observations. Changing endpoint coverage and the vendor/strength mix affects the package medians.
Monthly editions. This October 2026 edition is frozen at its dated archive URL. The main market-report URL shows the latest monthly edition. The earlier October 18 analysis is retained as a preliminary snapshot in the supporting data archive.
Reuse PeptidePrices’ analysis and derived data under CC BY 4.0, with attribution and a link to this report. Third-party laboratory reports and images retain their original rights.
Suggested citation: Ryan, J. / PeptidePrices (2026). The PeptidePrices Market Report for October 2026. 2026-10-21-v1. https://peptideprices.net/peptide-market-report/2026-10. DOI: 10.5281/zenodo.23548874.
Supporting data archive
The October 18 preliminary snapshot remains available for provenance. The August 2026 market-basket dataset retains its existing DOI; that identifier applies only to the August dataset.